Greenhouse gas and gold mines: Nearly 1 ton of CO2 emitted per ounce of gold produced in 2019
Gold mines emitted on average 0.8 tonnes of CO2 equivalent for every ounce of gold that was produced in 2019; however, stark differences exist both regionally and across open pit versus underground mining methods.
With prices testing and stabilizing at new highs, gold has been one of the best-performing metals of 2020, benefiting greatly from the uncertainty the year has brought. Strong price performance over the past several years has also led to a large number of new mines opening in recent years. With that in mind, and amid concerns of mining's impact on climate change as well as a growing environmental and social governance focus on financial portfolios, we present a review of greenhouse gas emissions from gold mines. Underground mines, which operate at higher grades and process less material, generally have lower greenhouse gas footprints than their larger open pit counterparts. For every ounce of gold produced, underground mines emit less than half the amount of carbon dioxide equivalent that open pits do. Given also that different regions apply different mining methods and have different power sources, trends in emissions from gold mines arise at a local level as well.
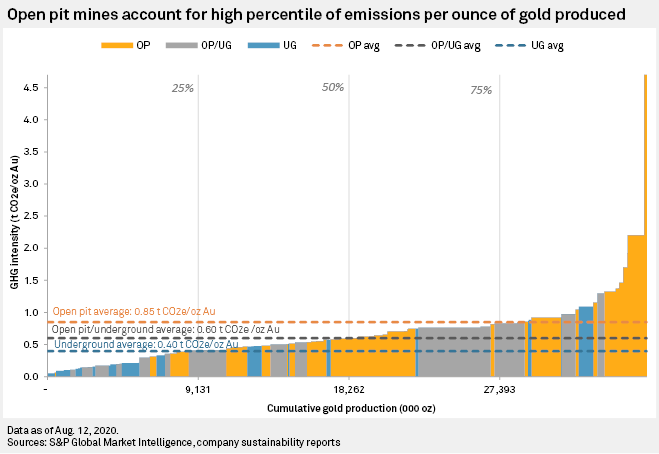
As underground mines are generally higher in grade than open pit mines, there is the assumption that open pit mines emit greater amounts of greenhouse gases than equivalent-producing underground mines. While there are more factors in greenhouse gas emissions than simply the volume of material moved and processed, there is a direct correlation between the two when we evaluate emissions as a function of production. This means the assumption stated above is valid, with open pit mines emitting on average around twice as much CO2e per ounce of gold produced as underground mines, at 0.85 tCO2e and 0.40 tCO2e, respectively. Open pit mines also process roughly five times the amount of ore at an average grade of around 1.05 g/t Au for the population evaluated, versus 3.25 g/t Au for underground mines.
We also looked at free cash flow from those same mines using S&P Global Market Intelligence’s discount cash flow models, based on the most-recently published set of consensus metals prices. While the larger gold mines do have the capacity to generate a greater amount of free cash, that large production base comes with higher emissions. Consequently, some see better-than-average returns per tonne of emissions.
Underground mines have an even clearer advantage on a free cash flow basis than was evident on a per-ounce of gold produced basis, generating as much as US$2,112/tCO2e emitted, compared to just US$951/tCO2e from open pit mines. While underground mines do generate more free cash flow than open pits — around US$422/oz versus US$375/oz — the scale is far greater on a greenhouse gas emissions level given the comparative lower emissions of underground mines.

