Mining exploration budgets rebound in 2017,
led by gold

By Mark Ferguson| 29 September 2017

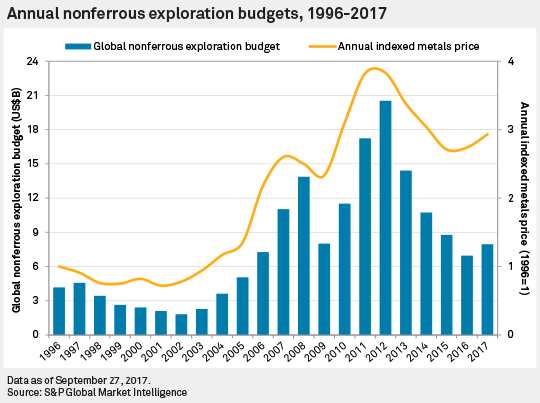
Newly released 2017 global exploration budget data from S&P Global Market Intelligence's Corporate Exploration Strategies series confirms the view held by many analysts and pundits that the mining exploration sector is firmly, but cautiously, emerging from a protracted downturn. Preliminary analysis shows that the annual global nonferrous exploration budget has increased for the first time since 2012, rising by more than 14% year over year to US$7.95 billion.

Improving market conditions and stronger metals prices since mid-2016 have encouraged many investors to reconsider the mining sector as an investment option, leading to a modest rebound in financing levels over the past 18 months — especially among the junior explorers. It is well known that the juniors have borne the brunt of the downturn since 2012; however, the budget data indicates that, among all company types, the surviving juniors are making a strong comeback in 2017, increasing their aggregate exploration budget by 23% year over year.

annual exploration budgets for non-ferrous metals 2017


Despite these improving conditions, the persistence of the downturn has continued to force some mining companies to halt spending or to leave the sector altogether. The 1,535 mining companies actively exploring in 2017 is a modest 3% decline from the 1,580 mining companies active in 2016; however, it is more than 1,000 mining companies less than in 2012, representing a remarkable 40% drop in the number of active explorers over the past five years.

Although the overall number of mining companies exploring remains relatively low, the 2017 data shows that many mining companies without budgets in 2016 have resumed their exploration efforts; we therefore expect the number of active explorers to increase in 2018.

After several years of belt-tightening, the major mining companies  have also registered a substantial budget increase in 2017, allocating 17% more for exploration than a year ago. Despite the higher budget growth among the pure junior explorers, the majors still dominate the exploration sector's efforts, accounting for almost 54% of the global budget.

As 2017 approaches its final quarter, we expect both of these groups, which collectively account for more than 80% of global exploration budgets, to continue increasing their exploration efforts well into 2018. Buoyed by sustained market interest, the juniors are expected to benefit the most, allowing their aggregate budget to grow at a faster pace than the producers' budget. As the mining industry rebound gains traction, we expect 2018 budgets to increase at about the same pace as this year.


Gold leads the charge

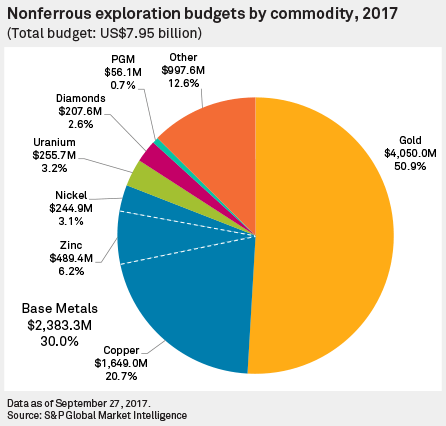
As was the case 15 years ago, when the industry began recovering from its previous extended downturn, an increase in planned gold exploration spending in 2017 is leading the industry out of the current slump. Benefiting from firmer metal prices since early 2016, gold explorers have increased their aggregate budget by 22% year over year to US$4.05 billion, a trend coinciding with a steady uptick in gold exploration activity documented by S&P Global Market Intelligence's Industry Monitor reports.

Zinc prices have also made a notable recovery since early 2016, driven mainly by underlying fundamentals, leading both producers and junior explorers to boost the aggregate 2017 zinc budget by 29% year over year to $489 million. Despite registering increases of 8% and 3% respectively, copper and nickel remain distinctly unappealing to junior explorers in 2017, with producing companies solely responsible for marginal increases in these commodities' budgets.

non-ferrous exploration budgets by commodity

Gain strategic insights into
global mining exploration trends.

Request a Demo


Form Header


Latin America remains king

Latin America's geological wealth and relative political stability continue to attract the bulk of exploration efforts, with the region's aggregate budget increasing 20% year over year to almost US$2.4 billion in 2017. Our Rest of World region, covering Europe and most of mainland Asia, has held onto second place by attracting 9% more allocations than in 2016, followed by Canada, Africa, Australia, the United States and Pacific/Southeast Asia. (Note: Given their size and importance to the industry, Canada, Australia and the United States are treated as regions for continental-scale comparisons.)

Perennial mining centers Canada, Australia and the United States have remained the top countries in 2017, with Canada recording a 12% year-over-year increase in budgets, and the other two countries each with 19% increases. Latin American countries occupy five of the top 10 most popular destinations, led by Chile, Peru and Mexico, and with Argentina slipping into 10th place ahead of the Democratic Republic of the Congo.
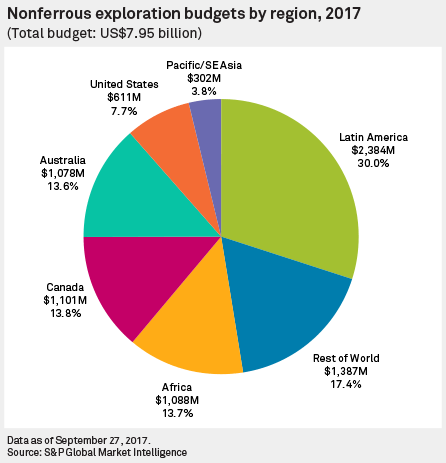
non ferrous exploration budgets by region


Riskier exploration still unattractive

As the Corporate Exploration Strategies (CES) series has documented over the past few years, exploration efforts have been increasingly focused at or near operating mines. The 2017 data shows that the minesite share (37%) of the global budget has risen above both the late-stage share (36%) and the grassroots share (27%) for the first time since the CES began in 1989. The long-term swing away from grassroots exploration has been exacerbated since 2013 by the collapse in market investment in junior explorers and sharp spending cuts by the major mining companies. Although improved market sentiment over the past 18 months seems to have slowed the decline in grassroots' share of budgets in 2017, another year of increase in the minesite share reflects a near-term focus by many producers, as well as a persisting climate of risk aversion.

Following the release of the 2017 exploration budget data for 1,535 mining companies, upcoming Corporate Exploration Strategies research reports will analyze global, commodity, geographic and exploration sector trends emerging from the data.


--- THE END ---


To find out more about our global Metals and Mining solution, please visit spglobal.com/marketintelligence.


Copyright © 2017 by S&P Global Market Intelligence, a division of S&P Global Inc. All rights reserved. No content may be reproduced or distributed without the prior written permission of S&P Global Market Intelligence or its affiliates. The content is provided on an “as is” basis.
 
Facebook LinkedIn You Tube

Copyright © S&P Global Market Intelligence Inc. All rights reserved.
Privacy Policy | Cookie Notice | Terms of Use | Disclosures | Do Not Sell My Personal Information