Gold M&A value down by half in 2016

By Nick Wright | 07 June 2017


Gold acquisitions slump in in 2016


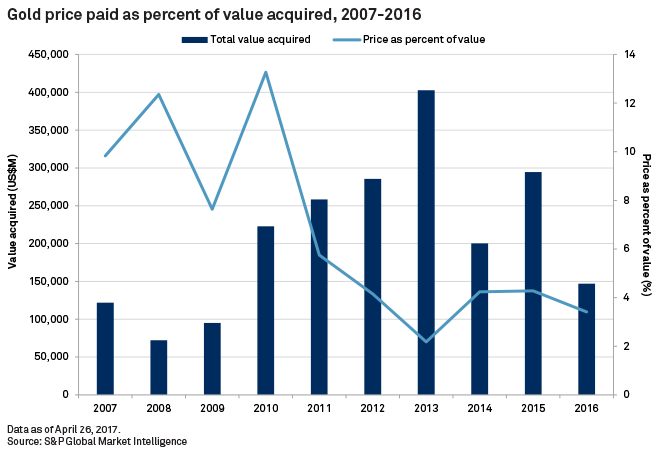
The total paid, and the unit valuations, for primary gold assets fell sharply in 2016. The total price paid during the year as a percentage of the total in situ value of all metals acquired in reserves and resources fell to only 3.4% from 4.3% in 2015, well below the 10-year median, which was also 4.3%.

As the financial crisis exploded on the global economy in 2008, the price paid for gold as a percentage of value jumped to 12.4% from 9.8% in 2007. This illustrated the increased value placed on gold during times of economic uncertainty. However, such was the severity of the collapse that not even gold assets escaped the general flight from risk and plunging asset values in 2009, and the share dropped to 7.6%.

Signs that the mining downturn may be short-lived, and soaring gold prices, resulted in a sharp rebound in gold asset valuations in 2010, with the price as a proportion of the acquired value hitting a high for the 10-year period of 13.3%. It should be noted that these simplistic calculations ignore the cost, and rate, of recovering the metal.

In 2011, nervous investors began questioning expansive acquisitions, which led to a three-year period of companies divesting noncore assets in order to rationalize their portfolios and reassure their investors. Base metals valuations, which remained supported for another year by demand from China, rose to 4.1% in 2011 from 3.2% in 2010, but the price paid for gold as a share of value plummeted by more than 50% year on year to 5.8%.

The downward slide in valuations for all metals hit bottom in 2013, with gold falling to an all-time low of 2.2%. It recovered somewhat in 2014 and 2015, with 4.2% and 4.3% respectively, before sliding again in 2016. The outlook for 2017, based on acquisitions in the first quarter, is for the number of gold deals and total price paid to be similar to 2016; however, gold valuations are likely to fall again this year.

For strategic insights into gold merger and acquisition trends, download the full report.

  • Gold acquisitions and average annual market prices from 2007-2016
  • Acquired gold and price paid between 2007-2016
  • Gold acquisitions by development stage, region and target country in 2016
  • Largest gold acquisitions in 2016
Chart on gold price paid as percent of value acquired

DOWNLOAD REPORT


Form Header

Copyright © 2017 by S&P Global Market Intelligence, a division of S&P Global Inc. All rights reserved. No content may be reproduced or distributed without the prior written permission of S&P Global Market Intelligence or its affiliates. The content is provided on an “as is” basis.
 
Facebook LinkedIn You Tube

Copyright © S&P Global Market Intelligence Inc. All rights reserved.
Privacy Policy | Cookie Notice | Terms of Use | Disclosures | Do Not Sell My Personal Information